The signal identification method used is “tophits_dataset-configured-imputation_ld_r”. This method identifies signals from the “dataset-configured-imputation” flavour summary statistics by iterative selection of lead variants and grouping other variants into the same signal via LD with that lead. With all required fields configured, the view displays a table of analyses which have a significant signal identified in the region.
1. View signals in region
To use the ‘view signals in region’ option, a region must first be selected (View Region).
Once enabled, click ‘view signals in region’, below the datasets search bar. A table will appear (figure 1), showing analyses which have at least one variant output from the selected signal identification method in the configured region. Studies are listed in order of decreasing significance (-log10(p) value) for their most-significant variant in the region. The table can also be sorted according to other columns by clicking on the column header.
Select datasets of interest using the check boxes on the left. Click ‘Add selected datasets’.
Plots will then be displayed.
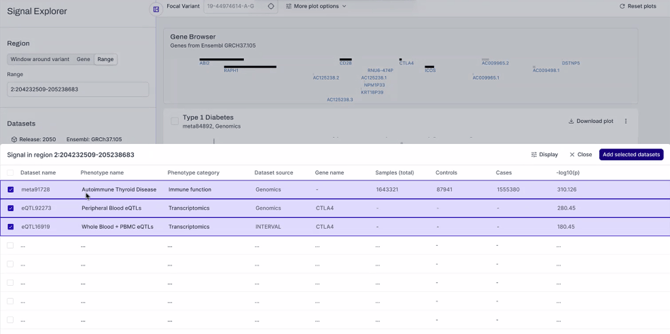
Figure 1: Search for datasets with significant variance in the region of interest.
2. Filtering options
Options for filtering the table are as follows:
- Variant property thresholds which limit which variants are valid for the inclusion of an analysis in the table:
- -log10(p)
- Minor allele frequency (in the population selected by Haplotype Population Set)
- Analysis filters which allow for inclusion or exclusion based on analysis metadata:
- Phenotype category
- Dataset type (e.g. GWAS, meta, eQTL, etc)
tophits_ld_r has filters on the variants which are input into the algorithm, as follows:
- Minus log10 p-value > 5 for selection of the lead variant for a signal, although it is possible for variants with lower significance to be included in called signals.
- Imputation INFO score > 0.95
- Minor allele frequency > 0.02
For -log10(p) or MAF, since these are configurable filters on the output of the signal identification algorithm, updating these values below the input thresholds defined may not have an impact on the displayed results.
Previous: How to Configure and view Manhattan plots?
Next: How to View the selected variant in Variant view?